Using AI-Driven Knowledge Graphs to Predict Project Delays Early
AI-driven knowledge graphs are transforming construction project management by analyzing historical data, weather patterns, and supply chain disruptions to predict delays before they happen. Discover how leading firms are moving beyond spreadsheets.
Introduction: The Spreadsheet Trap
For decades, the spreadsheet has been the undisputed king of construction project management. Excel files, shared via email, updated manually, and stored on local drives, have tracked schedules, budgets, and risks on projects worth billions of dollars.
But here is the uncomfortable truth: spreadsheets cannot predict the future.
They record what has already happened. They calculate what is currently budgeted. But when asked, “Will this project finish on time?” or “What will happen to my schedule if a typhoon hits our supplier’s port?”—the spreadsheet falls silent.
Enter AI-driven knowledge graphs. These are not databases. They are not dashboards. They are intelligent networks that understand relationships—between tasks, suppliers, weather patterns, labour markets, and historical project outcomes.
This article explores how AI-driven knowledge graphs are moving construction beyond the spreadsheet era, enabling project managers to predict delays, optimize schedules, and mitigate risks before they materialize.
Part 1: What Is an AI-Driven Knowledge Graph?
1.1 Beyond Relational Databases
A traditional database stores information in tables: rows and columns of structured data. It can tell you that Task A has a duration of 10 days and a predecessor of Task B. It cannot tell you why Task A is likely to be delayed if the concrete supplier is located in a flood zone.
A knowledge graph stores information as a network of entities (nodes) connected by relationships (edges). This structure mirrors how humans actually think: not in tables, but in associations.
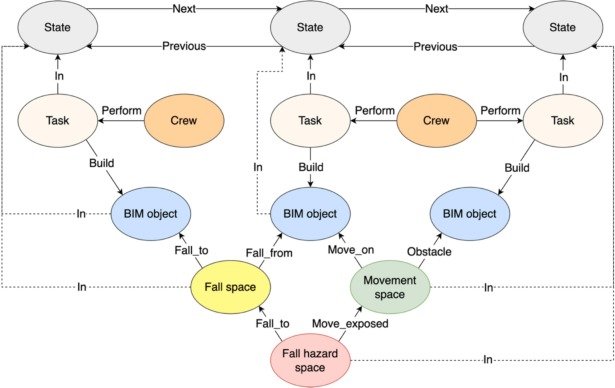
For construction project management, a knowledge graph might connect:
- Schedule tasks → performed by → Crews
- Crews → affected by → Weather patterns
- Materials → supplied by → Vendors located in → Geographic regions with → Historical disruption data
- Past projects → with similar → Risk profiles
This interconnected structure enables the graph to reason across domains that would remain siloed in traditional spreadsheets.
1.2 From Data to Knowledge to Foresight
The progression is critical:
| Level | Description | Construction Example |
|---|---|---|
| Data | Raw, unprocessed facts | “Concrete pour scheduled for May 15” |
| Information | Data in context | “Concrete pour scheduled for May 15, requires 3 trucks, 6 workers” |
| Knowledge | Information with relationships | “Concrete pour on May 15 historically delayed 40% of the time due to rainy season” |
| Foresight | Knowledge applied predictively | “Recommend rescheduling concrete pour to May 10 or securing weather insurance” |
Spreadsheets handle data and basic information. AI-driven knowledge graphs deliver knowledge and foresight.
1.3 The Technology Stack
Modern knowledge graph systems for construction typically combine several technologies:
- Graph databases (Neo4j, ArangoDB) for storing interconnected entities
- Graph neural networks (GNNs) and graph attention networks (GATs) for learning patterns in network data
- Large Language Models (LLMs) for natural language querying and document processing
- Node embedding algorithms (Node2Vec) for identifying critical elements in risk networks
Part 2: How Knowledge Graphs Predict Construction Delays
2.1 The Limitation of Traditional ML
Existing machine learning delay prediction models have a fundamental blind spot: they cannot process dependencies among construction progress records. A standard ML model might look at each task in isolation, predicting its delay probability based on its own characteristics. But construction projects are networks of interdependent activities. A delay in electrical rough-in cascades to drywall, painting, and final inspection.
2.2 Graph Attention Networks (GATs) for Delay Prediction
Researchers have developed graph attention networks (GATs) that explicitly model the relationships between construction activities. Unlike traditional models, GATs emphasize differential node significance—meaning they learn which tasks are most critical to the network and pay them proportionally more attention.
In a 2025 study published in the Journal of Management in Engineering, researchers configured data into six networks linking construction records based on:
- Contractual alignment (tasks linked by agreements and contracts)
- Spatial proximity (tasks occurring in the same physical location)
The results demonstrated that different dependency structures produce different predictive accuracies. For electrical tasks, contractual alignment predictions achieved 65% accuracy; for concrete tasks, 76%. For insulation tasks, spatial networks delivered 77% accuracy.
The practical application is immediate: When a specific task is predicted to fall behind—due to underestimation of person-hours or material quantities—the GAT model generates an alert. Project managers receive early warning and can reallocate resources or adjust schedules before the delay cascades to subsequent tasks.
2.3 Pre-Construction Delay Risk Networks
Delay prediction cannot begin after construction starts. The most critical delays often originate in the pre-construction phase—design changes, permitting delays, procurement issues, and contractual disputes.
A 2026 study in Computing in Civil Engineering developed a framework using graph representation learning to model pre-construction risks as an interconnected network. The researchers identified 30 construction delay factors validated by expert panels, then used the Analytic Hierarchy Process (AHP) to quantify dependencies between them.
Using the Node2Vec algorithm to compute node embeddings, they identified the most critical elements from two interfaces:
- Risk owner interface: The project team emerged as the most critical element
- Risk domain interface: Contractual risks were most critical
For project managers, this means: if you can only focus on one area to prevent pre-construction delays, focus on project team dynamics and contract clarity.
A complementary study developed a graph neural network (GNN) to analyze risk propagation, calculating network metrics including in-degree, out-degree, eigenvector centrality, and betweenness centrality to model how risks spread through the project network.
Part 3: Real-World Applications and Case Studies
3.1 The Agentic Platform for Schedule Risk
A global engineering leader with over $15 billion in active projects faced a classic problem: despite digital tools, critical project decisions still relied on spreadsheets and high-cost expert reviews. Decision delays were no longer a minor inefficiency—they were a scaling risk.
The company partnered with Persistent Systems to co-engineer an agentic platform using:
- A2A (Agent-to-Agent) architecture enabling multiple autonomous agents to communicate and reason
- MCP (Model Context Protocol) for tool integration
- Advanced RAG and knowledge graphs to ground generative outputs in structured decision graphs
The flagship deployment was a dynamic Schedule & Risk Workbook that proactively analyzes current and projected delays and recommends targeted interventions.
Results:
- 95% projected reduction in analyst effort
- 20% faster project delivery
- Up to 30% cost savings for mega construction programs
- Site managers can act independently without remote expert input
As the company noted: “The approach shifted the needle from project reviews to real-time risk response.”
3.2 GeoGraph Guardian: Supply Chain Risk Intelligence
The GeoGraph Guardian project demonstrated how knowledge graphs can integrate real-time weather data with supply chain networks. The system answers natural language questions like “What suppliers in Asia have the highest risk scores?” and uses GPU-accelerated graph analytics to identify vulnerable nodes, communities, and alternative sourcing options.
For construction, this means: when a typhoon is forecast for the Port of Shanghai, the knowledge graph can instantly identify every project task dependent on materials transiting that port, calculate the cascading delay impact, and suggest alternative suppliers or expedited shipping routes.
3.3 Tunnel Risk Identification Q&A System
A doctoral study at Kyungpook National University developed a question-answering system for construction risk identification in NATM tunnels. The system combines:
- A risk knowledge graph built in Neo4j capturing tunnel-specific risks
- GPT-3 for natural language question processing
The system enables project teams to query historical risk knowledge using plain language: “What risks occurred on similar tunnel projects with this geology?” The response draws from structured knowledge graphs grounded in actual project data, not generic LLM hallucinations.
Part 4: Integrating External Risk Factors
4.1 Weather Patterns and Climate Risk
One of knowledge graphs’ most powerful capabilities is integrating external, real-time data with internal project schedules. Weather data—forecasts, historical patterns, and climate trends—can be ingested as nodes in the graph, with edges connecting weather events to affected tasks.
A concrete pour requires dry conditions. The knowledge graph knows this. When a weather service predicts rain, the graph can:
- Flag the affected pour task
- Calculate the probability of delay based on historical forecast accuracy
- Suggest alternative dates with better weather probability
- Alert procurement to order additional tarpaulins or concrete retarder
4.2 Supply Chain Network Analysis
Traditional supply chain tracking asks: “Where is my material?” A knowledge graph asks: “What happens to my project if this shipment is delayed?”
By modeling the entire supply chain as a graph—suppliers, ports, shipping routes, customs clearance, warehouse storage, last-mile delivery—the system can perform cascading impact analysis. A delay at any node propagates through the graph, and graph algorithms (like shortest path or betweenness centrality) identify critical nodes whose failure would cause the most severe project impact.
4.3 Cross-Domain Knowledge Exploitation
Research on Digital Twins for Construction Safety (DTCS) has demonstrated how knowledge graphs enable cross-domain exploitation—extracting insights from safety data that inform schedule decisions, and vice versa.
In a case study, researchers showed how a knowledge graph could reveal the impact of delivery delays and crew reassignment on safety resource allocation and future tasks. The queries enabled by the graph include:
- “What is the impact of a 3-day concrete delivery delay on fall protection requirements?”
- “If I reassign this crew from Building A to Building B, what safety exposures change?”
- “Which tasks have the highest combined schedule and safety risk score?”
A spreadsheet cannot answer these questions because they require crossing domain boundaries. A knowledge graph, with its interconnected structure, can.
Part 5: From Reactive to Predictive – The Ontology Layer
5.1 The Need for Structured Knowledge Representation
Raw data is not enough. For AI systems to reason about construction delays, they need a formal ontology—a structured vocabulary of classes, properties, and relationships that the machine can process unambiguously.
Research has developed ontologies connecting:
- Building elements to job steps, activities, and tasks
- Tasks to potential hazards and safety regulations
- Hazards to mitigation measures and spatial artifacts
For delay prediction, a similar ontology would define:
- Delay causes (weather, labour, material, equipment, design, permitting)
- Delay effects (schedule slip, cost overrun, quality impact, safety risk)
- Mitigation strategies (resource reallocation, schedule compression, alternative methods)
When a knowledge graph is built on a formal ontology, queries can be mathematically precise, and reasoning can be logically sound—not just statistically probable.
5.2 Query Building Blocks and Natural Language Interfaces
A major advantage of knowledge graph systems is that they can support natural language querying. Users do not need to learn graph query languages like Cypher or SPARQL. They can simply ask.
Researchers have identified and categorized a series of query “building blocks” that enable transformation from natural language questions into formal graph queries. For example:
- “Show me all tasks affected by [external factor]”
- “What is the risk level for [specific activity]?”
- “Which suppliers have the highest [risk metric]?”
- “Recommend mitigation for [identified risk type]”
The GeoGraph Guardian system demonstrated this capability using Google’s Gemini API, allowing users to ask complex supply chain questions and receive answers grounded in the graph’s structured knowledge.
Part 6: Implementation Roadmap for Contractors
6.1 Start with a Pilot Project
Do not attempt to graph your entire project portfolio at once. Select one complex project with a history of delays. Extract schedule, cost, and risk data into a graph database. Add external data sources (weather, supplier locations, historical project data). Run the delay prediction models. Compare outputs to actual project outcomes.
6.2 Build on Existing BIM and Schedule Data
You do not need to start from scratch. Existing BIM models and scheduling tools (Primavera P6, Microsoft Project) contain structured data that can be exported into graph format. The MCP (Model Context Protocol) enables integration with existing tools without custom point-to-point connections.
6.3 Incorporate External Data Sources
The power of knowledge graphs comes from connecting internal project data with external signals. Prioritize:
- Weather data (historical and forecast)
- Geospatial risk data (flood zones, seismic activity, ground conditions)
- Supplier reliability metrics (on-time delivery rates, quality scores)
- Labour market indicators (union availability, wage trends)
6.4 Maintain Human Oversight
Knowledge graphs augment, not replace, project managers. The system’s recommendations should be reviewed by experienced professionals. The best approach is guided AI: the graph surfaces insights and predictions; humans make the final decisions.
6.5 Document and Refine
Each project provides new data to train the graph. Document actual delays, their causes, and their mitigation outcomes. Feed this back into the knowledge base. The system learns and improves with every project.
Part 7: The Future – Predictive Project Intelligence
7.1 Real-Time Risk Dashboards
The vision is a dashboard that does not just show current status but predicts future states. “Based on current weather, supplier performance, and crew productivity, we forecast an 87% probability of a 5-day delay at the foundation pour. Recommended actions: [list].”
7.2 Autonomous Mitigation
As agentic AI matures, knowledge graphs will not just recommend actions—they will execute them. An agent might automatically:
- Reschedule affected tasks in Primavera
- Notify downstream subcontractors of new dates
- Request expedited shipping from alternative suppliers
- Adjust crane rental periods to avoid idle time
The global engineering leader’s “agentic platform” demonstrated this capability, with autonomous agents communicating and cooperating without human intervention.
7.3 Industry-Wide Knowledge Graphs
The ultimate evolution is industry-wide knowledge graphs that learn from thousands of projects across multiple contractors. A firm starting a hospital project in Texas could query the graph: “Show me all similar hospital projects in this climate zone, their common delay causes, and the mitigation strategies that worked.”
This is not possible with spreadsheets. It is not even possible with siloed AI systems. But with shared knowledge graphs, built on common ontologies, it becomes achievable.
Conclusion: The Spreadsheet Era Is Ending
The AI-driven knowledge graph is not a marginal improvement over spreadsheets. It is a fundamentally different paradigm for understanding and managing construction projects.
Spreadsheets store data in isolated tables. Knowledge graphs store knowledge in interconnected networks.
Spreadsheets answer “what happened.” Knowledge graphs answer “what will happen—and what should I do about it?”
Spreadsheets are reactive. Knowledge graphs are predictive.
The global engineering leader that achieved 95% reduction in analyst effort and 20% faster project delivery was not using a better spreadsheet. They were using a knowledge graph. The researchers predicting pre-construction delays with graph neural networks were not using regression models on flat files. They were using risk networks. The tunnel project identifying risks with GPT-3 was not searching PDFs. They were querying a knowledge graph.
The question is no longer whether knowledge graphs will replace spreadsheets for construction delay prediction. The question is how quickly your organization will make the transition.
The projects that move first will win the bid, protect the margin, and deliver on time.
The ones that do not will keep asking why their spreadsheets never saw the delay coming.
Frequently Asked Questions (FAQ)
What is a knowledge graph in construction?
A knowledge graph is a network of entities (tasks, crews, suppliers, weather events) connected by relationships. Unlike spreadsheets, it captures how different project elements interact and influence each other.
How do graph attention networks (GATs) predict delays?
GATs model dependencies between construction activities, learning which tasks are most critical to the project network. They generate alerts when specific tasks are predicted to fall behind, enabling proactive intervention.
Can knowledge graphs integrate weather and supply chain data?
Yes. Systems like GeoGraph Guardian combine real-time weather data, supplier locations, and logistics networks with project schedules to predict cascading impacts of external disruptions.
What results have been achieved with these systems?
A global engineering leader achieved 95% reduction in analyst effort, 20% faster project delivery, and up to 30% cost savings using an agentic platform with knowledge graphs.
Do I need perfect data to start?
No. Begin with a pilot project using existing schedule and risk data. Add external data sources incrementally. The system improves as more data is incorporated.
How do knowledge graphs differ from traditional AI delay models?
Traditional ML models process records in isolation. Knowledge graph-based models process dependencies between records, better reflecting human understanding of construction progress.
Call to Action (CTA)
Are you still managing project risk in spreadsheets? It is time to move beyond. Start with a pilot project this quarter. Map your schedule, risks, and external dependencies into a graph. And if you are already using knowledge graphs for delay prediction, share your experience in the comments below.